


When choosing LED lighting, product specifications can tell you a lot about how a fixture will perform. But if you want to understand how a light actually performed during testing, a photometric report provides much more detailed information.
A photometric report documents the measured optical, electrical, and color characteristics of an LED fixture. It can help electricians, lighting designers, engineers, architects, and other lighting professionals compare products and understand exactly what a fixture produces.
For single color and white LED lighting, a photometric report includes information such as color temperature, lumens, power consumption, efficacy, CRI, and TM 30 color performance. Color changing fixtures, such as RGB and RGBW LED products, are measured differently because they are designed to produce multiple colors rather than a single white light.
Here is what to look for when reading an LED photometric report.
What is a Photometric Report?
A photometric report is a record of the measured performance of a lighting fixture during laboratory testing.
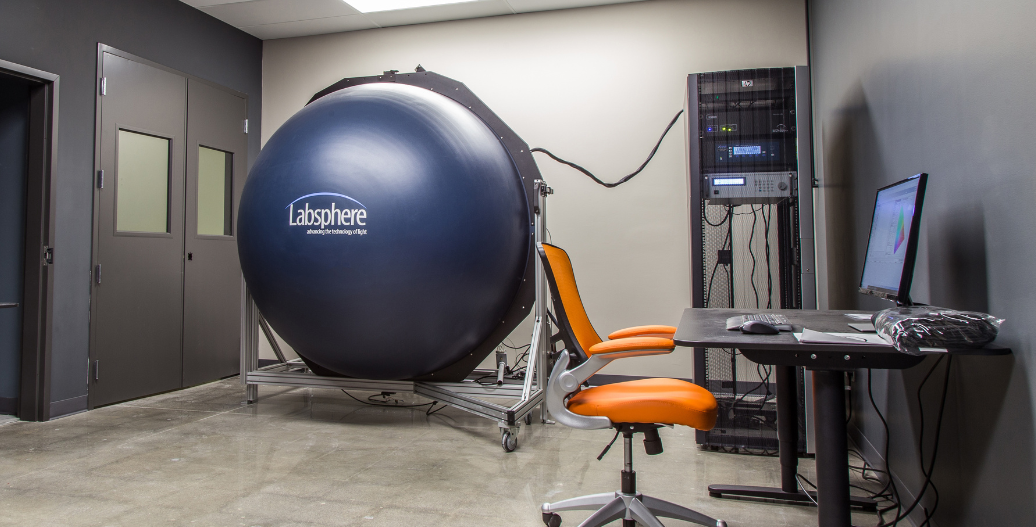
The report is generated using data collected from an integrating sphere, which measures the total light output and other characteristics of the fixture. The resulting data is used to document the fixture's brightness, electrical performance, color characteristics, and spectral distribution.

Photometric reports are useful when you need more than the basic specifications listed on a product page. They provide measured data that can help you determine how a fixture actually performs under specific testing conditions.
You can view an example of a single color LED photometric report from aspectLED here: AL-SL-LN-IP20-24 Photometric Report
What is an Integrating Sphere?
Before looking at the individual sections of a photometric report, it helps to understand how the data is collected.
An integrating sphere is a specialized testing device used to measure the total light output of a lighting fixture. The inside of the sphere is designed to distribute light evenly so the fixture's overall optical performance can be measured.
The photometric report will identify the sphere geometry used during testing. You will typically see either 2π or 4π.
What Does 2π Mean?
With 2π testing, the fixture is positioned at the back of the integrating sphere. This testing arrangement is commonly used for fixtures that primarily emit light in one direction.
What Does 4π Mean?
With 4π testing, the fixture is positioned in the center of the integrating sphere. This allows light to be measured in all directions around the fixture.
The sphere geometry is important because it provides context for how the fixture was positioned and tested.
What Should You Look at First?
You do not need to understand every number in a photometric report to get useful information from it.
For most LED lighting applications, start with these measurements:
CCT: What color temperature does the white light produce?
Lumens: How much light does the fixture produce?
Watts: How much electrical power does it consume?
Volts: What voltage was the fixture tested at?
Amps: How much current does it draw?
Efficacy: How many lumens does it produce per watt?
CRI Ra: How accurately does a white light source render colors?
TM 30 Rf: How accurately does the fixture render the larger set of TM 30 colors?
TM 30 Rg: Are the colors less saturated, more saturated, or close to the reference?
For RGB and RGBW products, focus instead on the measured output of the individual color channels and their spectral distribution.
Understanding the Top Section of a Photometric Report

The first section at the top of the report provides general information about the fixture that was tested.
This typically includes the product SKU and description so you can identify exactly which product and configuration the report represents.
The sphere geometry will also be listed in this area. When comparing photometric reports, make sure you understand whether the fixtures were tested using 2π or 4π geometry.
Spectral Distribution

The next major section is the spectral distribution graph.
This graph shows the amount of light produced at different wavelengths across the visible light spectrum. Looking at the graph can help you understand which wavelengths and colors are strongest in the light source.
For example, a white LED will produce energy across a range of visible wavelengths, while a color changing LED will show more distinct peaks corresponding to its individual LED colors.
The spectral distribution is particularly useful for lighting professionals who need to understand the actual composition of the light being produced rather than simply knowing its color temperature.
The Most Important Performance Specifications
For most people reading a photometric report, the most useful information is found in the main performance specifications.
These measurements tell you how bright the fixture is, how much electricity it uses, and how efficiently it converts electrical energy into light.
CCT
CCT stands for Correlated Color Temperature.
CCT is measured in Kelvin, represented by the letter K. It describes the appearance of white light from warm to cool.
Lower CCT values produce warmer looking light, while higher CCT values produce cooler looking light.
For example:
- 2700K produces a warm, soft white appearance.
- 3000K produces a warm white appearance that is common in residential and hospitality applications.
- 4000K produces a neutral white appearance.
- 5000K produces a cooler, daylight style appearance.
CCT is primarily relevant to white light. Color changing fixtures require a different approach because their color output can change.
Lumens
Lumens measure the actual light output of the fixture.
Unlike watts, which measure electrical power consumption, lumens tell you how much visible light the fixture produces.
A higher lumen measurement generally means more light output, although the right amount of light depends on the application.
Power
The power section shows the electrical characteristics of the fixture during testing and includes watts, volts, and amps.
Watts measure the total electrical power consumed by the fixture. This helps determine how much electricity the fixture uses and is useful when comparing the energy requirements of different LED products.
Volts indicate the operating voltage measured during testing. For low voltage LED lighting, this will commonly be 12V DC or 24V DC. The voltage listed in the report confirms the electrical conditions under which the fixture was tested.
Amps measure the electrical current drawn by the fixture. This is particularly important when selecting a power supply, determining circuit loading, and planning an LED installation.
Together, these measurements provide a clear picture of the fixture's electrical requirements. When comparing LED products, it is useful to consider power consumption, voltage, current, and light output together rather than looking at any single measurement in isolation.
Efficacy
Efficacy measures how efficiently a fixture converts electrical power into light.
It is expressed as lumens per watt, or lm/W.
For example, if an LED fixture produces 9478 lumens while consuming 100 watts, its efficacy would be 94.78 lumens per watt.
A higher efficacy means the fixture produces more light for each watt of electricity consumed.
Efficacy is one of the most useful measurements for comparing the energy efficiency of different LED fixtures.
What are the CIE Measurements?
Further down the report, you may see a series of highly technical spectral measurements associated with CIE standards.

For most consumers, electricians, contractors, and lighting professionals, these measurements are not necessary for everyday product selection.
They are more commonly used by advanced lighting professionals, researchers, engineers, and professors who need detailed information about the spectral characteristics of a light source.
If you are primarily trying to determine how bright a fixture is, how much power it uses, how efficient it is, and how accurately it renders color, you can generally focus on the primary performance specifications and color metrics.
Understanding CRI and Color Rendering
One of the most important sections of a photometric report for white LED lighting is the color rendering information.
CRI stands for Color Rendering Index.
CRI describes how accurately a light source renders colors compared with a reference light source.
The most commonly referenced CRI measurement is the Ra score, which represents the average of the first eight CRI color samples from a total of 15 sample colors.
CRI is measured on a scale where 100 represents the highest possible score.
As a general rule, a CRI of 90 or higher is considered very good color rendering.
The individual CRI measurements provide additional information about how accurately the light renders specific colors.

What is CQS?
You may also see CQS, or Color Quality Scale, in a photometric report.
CQS is another method for evaluating color rendering and color quality. It is less commonly referenced than CRI, but some lighting professionals use it when comparing different light sources.
For most applications, CRI and TM 30 provide more useful information for evaluating the color quality of a white LED fixture.
Understanding TM 30
TM 30 is another color evaluation system used to provide a more detailed picture of color rendering.
One of the biggest differences between CRI and TM 30 is the number of color samples used during evaluation.
CRI traditionally uses a relatively small set of color samples, while TM 30 evaluates a much larger set of 99 color evaluation samples.
TM 30 also provides information about both color fidelity and color gamut.
The two numbers most people should pay attention to are Rf and Rg.

What Is Rf?
Rf represents color fidelity.
It is somewhat comparable to the CRI Ra score and indicates how accurately the light source renders colors compared with the reference source.
As with CRI, a value closer to 100 indicates higher color fidelity.
What Is Rg?
Rg represents color gamut, or color saturation.
Unlike Rf, the ideal Rg value is not simply the highest possible number.
A score of 100 represents the reference level of saturation.
A score below 100 indicates that the colors measured by the light source are less saturated than the reference.
A score above 100 indicates that the colors are more saturated than the reference.
In other words, an Rg value of 100 represents a very close match to the reference level of color saturation.
TM 30 Color Samples
Another section of the photometric report shows the individual color fidelity measurements for the 99 TM 30 color samples.

This provides a much more detailed look at how the light source renders different colors.
The graph below the individual measurements provides visual examples of the colors represented by those samples.
For most lighting applications, you do not need to analyze all 99 measurements individually. However, this information can be extremely useful when precise color performance matters, such as in retail, museums, galleries, hospitality, photography, or other applications where color appearance is important.
Understanding the Color Vector Graphic
Near the end of the report, you will find the TM 30 color vector graphic.

This graphic provides a visual representation of how the light source's color rendering compares with the reference source.
The black circle represents the reference, while the colored vector information shows how the tested light source deviates from that reference across different portions of the color spectrum.
In general, the closer the measured results are to the reference circle, the more closely the light source matches the reference in terms of color rendering and saturation.
This graphic can provide a quick visual way for experienced lighting professionals to identify where a light source is rendering colors differently.
How Color Changing LED Photometric Reports Are Different
Photometric reports for RGB and RGBW LED fixtures look different from reports for single color or white LED fixtures.
This is important because CRI and TM 30 are primarily designed to evaluate white light sources.
RGB fixtures do not follow the same white light measurement standards, so an RGB photometric report will not contain the same TM 30 information you would find in a white LED report.
In fact, a color changing fixture may have a relatively low CRI measurement even though it is performing exactly as designed.
This is because CRI is intended to evaluate how accurately a white light source renders colors. An RGB fixture is designed to intentionally produce saturated colors by combining different colored LED channels.
Therefore, you should not use a low CRI score by itself to determine whether an RGB fixture is a high quality product.
What Does an RGB or RGBW Photometric Report Show?
For RGB and RGBW products, the photometric report provides measured data for the individual color channels.

This can include the measured wavelengths associated with each color, allowing you to see the actual spectral output of the red, green, blue, and white channels.
An RGB report therefore answers a different question than a single color white light report.
Instead of primarily asking, "How accurately does this fixture reproduce white light?" you are looking at how the fixture produces its individual colored wavelengths and how those channels perform.
You can view an example of an RGB LED photometric report from aspectLED here: AL-SL-LN-IP20-24-RGB Photometric Report
Why Photometric Reports Matter
A photometric report provides measured data that gives you a deeper understanding of an LED fixture's actual performance. While a product specification sheet provides general product information, a photometric report allows you to evaluate light output, electrical performance, color quality, and spectral characteristics when comparing products for a specific application. For white and single color LED lighting, focus on measurements such as lumens, watts, efficacy, CCT, CRI, and TM 30. For RGB and RGBW color changing lighting, look at the individual color channels and spectral distribution rather than relying on white light metrics such as CRI or TM 30. Once you understand what each section means, a photometric report becomes a useful tool for comparing LED products and selecting the right lighting for your application.


